Trend Tag Settings
Settings for a tag is accessed by the cog wheel button to the right in the Tag definition area.

Settings
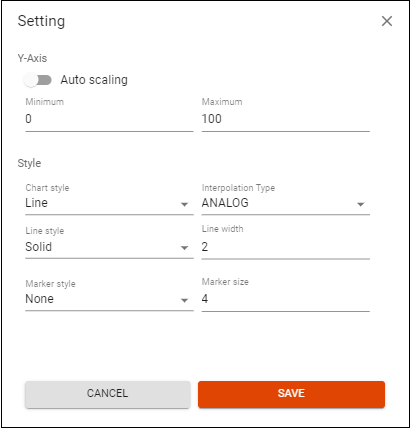
Y-axis
Settings for the y-axis.
Auto-scaling
If Y-axis auto-scaling is selected the y-axis adjust the scaling to the min and max presented in the curve for the chosen period.
Minimum Maximum
Define the scaling of the y-axis yourself, by entering numbers in the minimum and maximum fields.
Style
Style settings for the trend curve.
Chart Style
The following chart styles are available:
- Line - Default
- Area - Fills the area under the trend curve
- Spline - A spline chart is a line chart that uses curves instead of straight lines
Interpolation Type
Set how the curve is presented between the the data points.
- ANALOG - Default
- STEP
- BSTEP
- CENTERSTEP
- DISCRETE - Data point values are not connected
Line Style
Set the appearance of the line. For example Solid, dot or dash. It is also possible to hide the line.
Line width
Set the width of the line.
Marker style
Set the style of the data point marker. Default is none. Can be change to for example a circle or square.
Marker width
Set the width of the marker.